

AirMacro: Macro Dashboard for Market Watchers
See the economic releases and central-bank decisions that move markets on one page, with times shown in your own time zone.
パブリッシャー のコンピューターで実行されます
S提供元: Spartacus lab 2 インストール試用はアカウントなしで続けられます。インストールには有効な AirCode Ø アカウントが必要で、その後は作成者がホストするアプリで安全に続行します。
この appについて
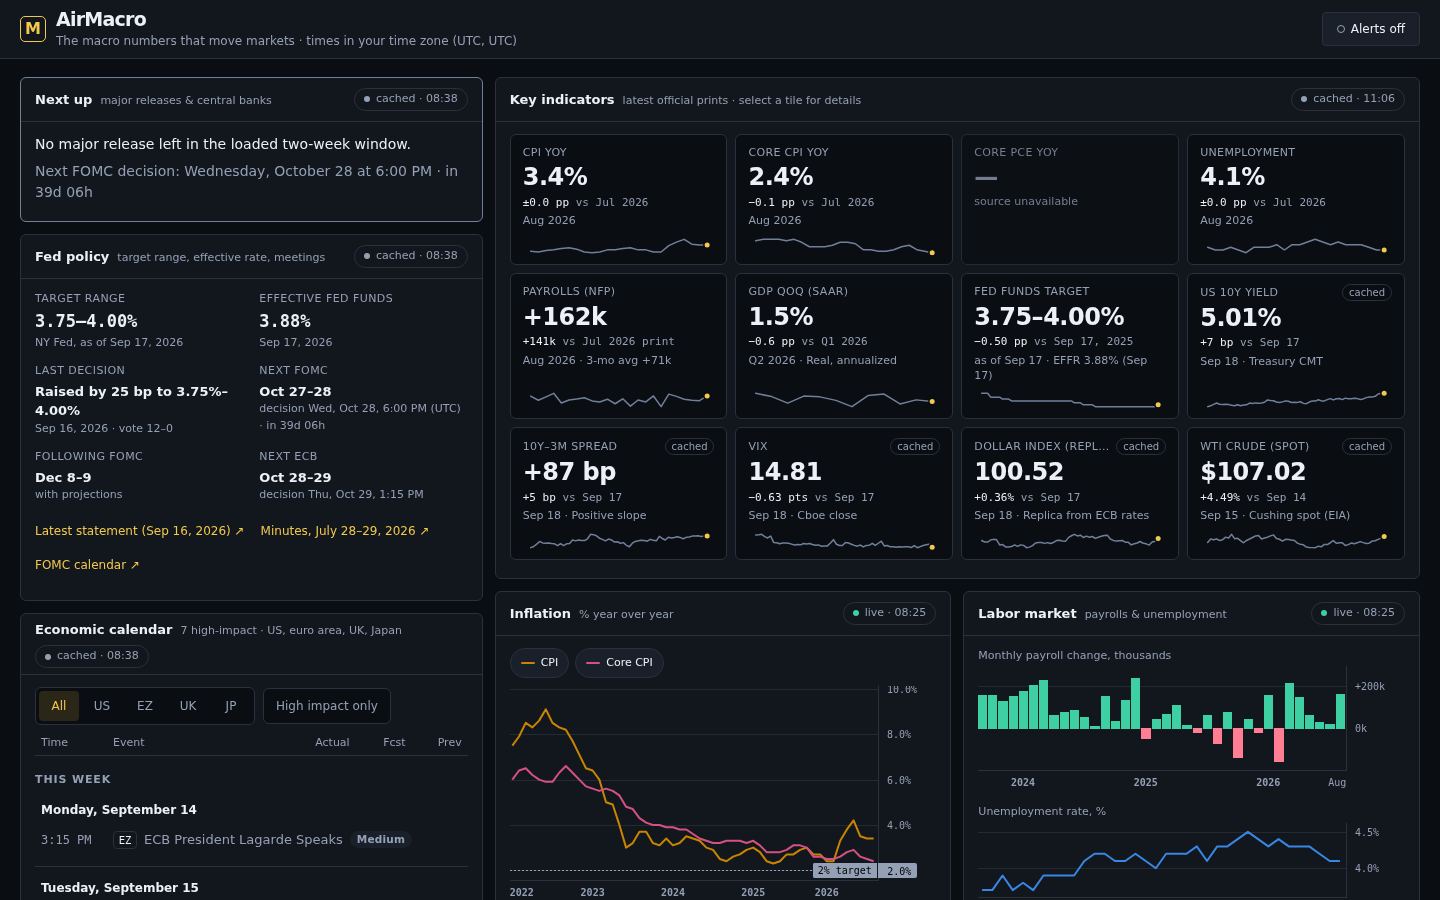
AirMacro puts the macro picture on a single page. It counts down to the next central-bank decision and shows the current Fed policy settings. A weekly economic calendar covers the US, euro area, UK and Japan, with actual, forecast and previous figures side by side. Tiles show the latest official prints for inflation, jobs, GDP, Treasury yields, the VIX, the dollar and crude oil. Each chart panel also has a short plain-English summary, such as whether the yield curve is inverted or how inflation compares with the 2% target. Figures come from public sources like BLS, BEA, the US Treasury, the Federal Reserve, the ECB and the EIA. Labels show when each panel last updated and whether its data is live or cached.
AI ビルドアクティビティ
プロジェクト合計 · 建物およびメンテナンスを含む。 パブリッシャー によって共有されたスナップショット。 Apps このプロジェクトを共有すると、これらの合計が共有されます。
- 実行
- 18
- AI 実行時間
- 5時間16分
- モデル呼び出し
- 709
- トークン
- 282,046,398
- USD 同等
- $270.98
推定 API 相当のコスト。
- claude-opus-5claude · 58.4% トークン164,697,925 トークン · 443 通話 · $115.61
- claude-fable-5claude · 41.6% トークン117,348,473 トークン · 266 通話 · $155.38
保持されたローカルアクティビティ。 実行は記録された完了済みの AI ターンです。実行時間は記録されたアクティブな作業の合計です。モデルのシェアはトークンに基づいています。
記録 2026/09/22 15:49 · 出版社が報告した活動、難易度または品質評価ではありません。
Source for this release このリリース
AirCode Ø は Spartacus labの名義でこのクリーン パブリック ソース 鏡をホストします。 リポジトリと正確なコミットは、このリストが検証されたときに公開されましたが、これはセキュリティ認証ではありません。
- ライセンス
- MIT
- 宣言コミット
190fd82fe596ed1d3bd66fa428b4d20b1757cd81
何が役に立つのか
リアルワークのために作られた
Prepare for the week by checking which rate decisions and data releases are coming up, and when they happen in your time zone
Right after a release, compare the actual number with the consensus forecast and the previous reading
Check whether the yield curve is inverted and how the VIX compares with its two-year range
キャプチャ製品
どうやって働くか見る
On desktop, the page opens with a Next up countdown and the Fed policy panel. Below them are the weekly economic calendar with region filters, a grid of key indicator tiles, and chart panels for inflation, the labor market, rates and growth.
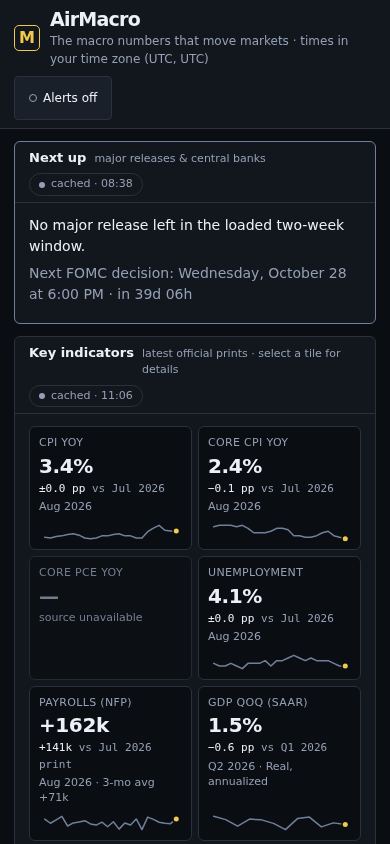
On mobile, the layout moves the key indicator tiles near the top so the latest numbers come first. The calendar, Fed policy panel and chart summaries follow in a single column.
あなたのスクリーンで働く
Creator-hosted アプリケーション
このリストとそのキャプチャは AirCode Øによってホストされています。 ライブアプリは、作成者の独自のマシンで実行され、独自のアカウントまたはデータポリシーを持っている可能性があります。 Marketplace 出版は、ソースコードがレビューまたは認証されたことを意味しません。